

What is a Flowchart?-With example.
Definitions of a Flowchart:
- A flowchart is a graphical or symbolic representation of a process.
- A flowchart is a pictorial representation of sequence of steps to solve a problem.
Symbols used in Flowchart:
- Start and End Symbol:
Start and End symbols are also known as terminal symbols. They are represented as rounded rectangles. Terminal symbols are always the first and the last symbols in a flowchart.

Arrow:
Arrows shows the flow of the control of the program. They explain the exact sequence in which the instructions are executed.

Processing:
Step Processing step is also known as activity, and it is represented by rectangle. Activities include the instructions such as add a to b, save the result. Therefore, the processing symbol represents arithmetic and data movement instructions. When more than one process has to be executed simultaneously, they can be placed in the same processing box. The execution of the statements will be carried out in the order of their appearance.

Input / Output Symbol:
Input and output symbols are represented using a parallelogram and are used to get inputs from the users and display results to them.

Conditional or Decision Symbol :
Conditional or decision symbol is represented using a diamond. It is basically used for Yes/No
question or a True/False test. The two symbols coming out of it corresponds to one for Yes or True
and the other for No or False. The arrows should always be labelled.

Connector:
Connectors are represented by a circle and there must be identifying label inside a circle. They are used in a multi-sheet diagrams to substitute for arrows. For each label, the ‘outflow’ connector must have one or more ‘inflow’ connectors.

Significance of Flowchart:
- Flowcharts help the programmers to understand the logic of complicated and lengthy problems.
- Once the flowchart is drawn, it becomes easy for the programmer to write the program in any high level language.
- A flowchart follows top-down approach in solving problems.
Flowchart Examples:
Ex. 1 Draw a flowchart to add two numbers.

Ex. 2 Draw a flowchart to calculate salary of daily wager.

Ex. 3 Draw a flowchart to calculate the sum of first 10 natural numbers.

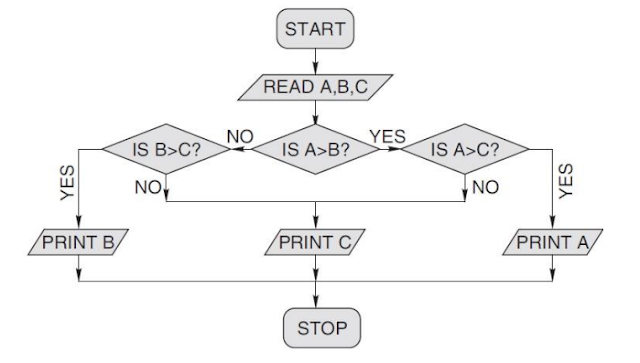
Ex. 4 Draw a flowchart to find the largest of three numbers.
Ex. 5 Draw a flowchart to calculate simple interest.

Advantages of Flowchart:
- Communication:
Flowcharts are a better way of communicating the logic of a system to all concerned.
- Effective Analysis:
With the help of flowcharts, problems can be analyzed more effectively.
- Proper Documentation:
Program flowcharts serve as a good program documentation needed for various purposes.
- Efficient Coding:
Flowcharts act as a guide or blueprint during the systems analysis and program development phase.
- Proper Debugging:
Flowcharts help in the debugging process.
- Efficient Program Maintenance:
The maintenance of an operating program becomes easy with the help of a flowchart.
Disadvantages of Flowchart:
- Complex Logic:
Sometimes, the program logic is quite complicated. In such a case, a flowchart becomes complex and inappropriate. Imagine a flowchart for a program having 50,000 statements.
- Alterations and Modifications:
If little bit alteration is required, the flowchart may need to be redrawn completely.
- Reproduction:
Since the flowchart symbols cannot be typed in, the reproduction of a flowchart becomes a problem.
- Loss of Objective:
The essentials of what has to be done can easily be lost in the technical details of how it is to be done.
Now, you clear all the basic concepts of Flowchart.


0 Comments